Climate change
ESRS 2 SBM-3
As an energy- and resource-intensive industry, the construction sector has a key role to play in and exerts considerable influence on the transition to a low-carbon economy. Fossil fuels are used along the entire value chain, from the operation of production facilities and construction machinery to the operation of the structures we build. This makes the construction industry a source of process- and energy-related emissions. STRABAG therefore seeks to continuously reduce greenhouse gas emissions along the entire value chain (Scope 1, 2 and 3) to achieve the target of climate neutrality by 2040 approved by the SE Management Board. We understand climate neutrality in the sense of the United Nations Framework Convention on Climate Change (UNFCCC, 2021) as the endeavour to minimise greenhouse gas emissions as far as possible and to offset those emissions that are difficult to avoid through targeted compensation measures. According to the current status, targeted compensation measures, such as the purchase of carbon offset certificates, are not expected to be used until the target year 2040. They are intended exclusively to cover the emissions that remain after all technically and economically feasible reduction measures have been exhausted.
For this purpose, a climate transition plan with a corresponding reduction pathway based on science-based targets was developed in the 2024 reporting year. The underlying principles as well as the progress made are described in the following chapter.
In addition to the consistent implementation of actions aimed at climate change mitigation, the impacts of climate change are already being felt today, which makes adaptation processes necessary as well. Construction companies have a decisive role to play in this context. On the one hand, actions to adapt to climate change – such as the construction of protective structures – must already be taken today. On the other hand, sustainable, climate-resilient construction methods can help make buildings and cities more resilient to extreme weather events.
Structures today are built with the aim to have a long service life, to be resource-efficient throughout their operation, and to be able to be repurposed or dismantled at the end of their life cycle. We expect this trend to continue to gain strength in the future, with circular construction and expertise in the energy sector playing a key role in this development. For this reason, STRABAG has defined these areas as key strategic topics and will continue to expand the relevant business models. With our services, we seek to play an important role in the transition to climate-neutral buildings and infrastructure.
Our transition plan
ESRS E1-1
As part of the strategic objective of achieving climate neutrality by 2040, STRABAG has set a science-based interim target for 2030 in accordance with the Science Based Targets initiative (SBTi), thereby committing to mitigating climate change in line with the 1.5 °C target. The underlying resolution was adopted by the Management Board of STRABAG SE. As the target influences the Group’s strategic direction, the Supervisory Board was also informed by the Management Board. The central element is a greenhouse gas reduction pathway with science-based targets and corresponding management tools.
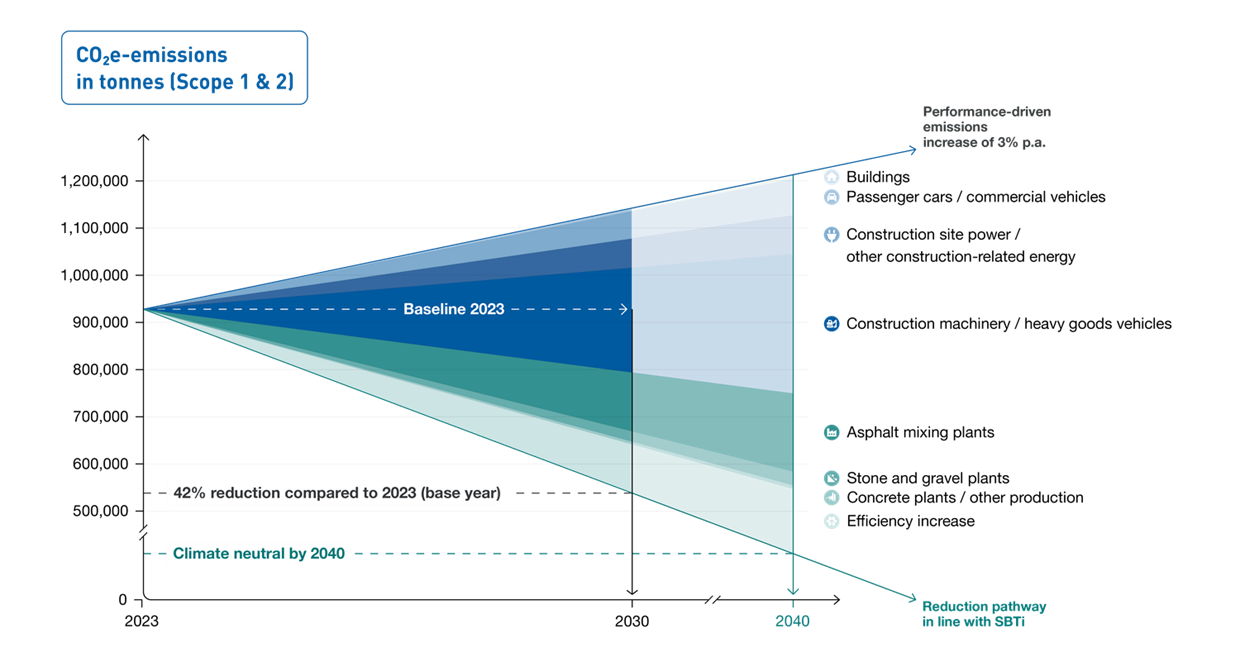
Based on an analysis of the Group’s energy consumption, seven action areas were identified, supplemented by the potential for efficiency increases as a separate action area. These action areas were defined on the basis of the Group’s largest CO2e reduction potentials. Key actions were specified for each of these action areas in order to avoid or reduce the consumption of fossil energy sources. Specifically, these are:
- Buildings: climate-neutral operation of administration buildings (own and third-party) used by the Group
- Passenger cars / commercial vehicles: conversion of vehicle fleet to renewable energy sources
- Construction site power / other construction-related energy: electrification and environmental optimisation of small equipment, office containers and cranes
- Construction machinery / heavy goods vehicles: conversion of construction machinery and heavy goods vehicles to renewable energy sources
- Asphalt mixing plants: conversion of asphalt mixing plants to renewable energy sources
- Stone and gravel plants: conversion of stone and gravel plants to renewable energy sources
- Concrete plants / other production: conversion of concrete plants and other production to renewable energy sources
- Efficiency increase: leveraging energy efficiency potential through introduction of new technologies such as electrification
The CO2e reduction potentials for Scope 1 and Scope 2 emissions were determined for each action area on the basis of a future energy target scenario – both for the interim target year 2030 and the target year 2040. The calculations took into account existing and foreseeable technological developments as well as the expected availability of relevant energy sources. Taking into account additional emissions growth resulting from increased output, the following reduction pathway – broken down by reduction potential per action area – results for achieving the SBTi target by 2030 (for Scope 1 and Scope 2 emissions).
Transition plan
To manage the plan, STRABAG has developed an internal set of KPIs to measure the effectiveness and progress of the ongoing actions. At present, progress is on track in five of seven action areas or shows only minor to moderate deviations. For key actions in the action areas, capital expenditure (CapEx) and operating expense (OpEx) were estimated, taking into account climate policy and energy-market framework conditions. The results of the assessment indicate that implementing the reduction pathway is generally financially feasible under the scenarios considered and – based on the assumptions made – may be associated in the long term with lower aggregated cash outflows compared with a business-as-usual pathway.
Scope 3 emissions account for around 90% of the corporate carbon footprint of STRABAG SE. The main drivers are purchased goods and services (in particular building materials) as well as the use phase of buildings and infrastructure. The reduction pathway for Scope 3 therefore focuses on the action areas “Structures” and “Building materials”, with the direct actions “Increasing energy efficiency and circularity of structures” and “Increasing the use of low-emission building materials”, supplemented by the indirect actions “Customer engagement”, “Data basis for sustainable procurement”, “Supply chain engagement” and “Research and development”. Taking into account emissions growth resulting from increased output, the following reduction pathway results for achieving the SBTi target by 2030 for Scope 3 emissions. As the target contributions of the two action areas “Structures” and “Building materials” are currently being developed, the two graphical areas are shown with a hatched transition.

As a construction company, the consideration of locked-in emissions is also of central importance for STRABAG, as the structures built generally have a service life of several decades. The conversion of the Group’s own production facilities for building materials such as asphalt and concrete from fossil to renewable energy sources is taken into account in the transition plan, meaning that no significant locked-in emissions are expected in this area in the long term. The situation is different for STRABAG’s actual products, particularly buildings that have been constructed, whose emissions are accounted for under Scope 3.11 (use of sold products). Actions to reduce product-related emissions have already been developed. Their effectiveness, however, depends largely on framework conditions within the construction and real estate industry – particularly with regard to statutory sustainability standards for buildings and the requirements of commissioning clients. As STRABAG has only limited influence over these external factors, this represents an uncertainty factor for the transition plan, particularly with regard to achieving the targets for reducing Scope 3 emissions.
The EU Paris-Aligned Benchmark Regulation (EU PAB) does not apply to STRABAG.
Policies
ESRS E1-2
The Group-wide Environmental and Energy Policy was revised in 2025 and approved by the Management Board of STRABAG SE in the first quarter of 2026. The policy sets out fundamental principles and action areas relating to climate and decarbonisation, circular economy, biodiversity and ecosystems, and sustainable supply chains. The document also defines responsibilities for implementing these action areas.
A central premise of the document is that sustainable business practices form the basis for future-proof business models and for actively adapting to the impacts of climate change. In the area of climate and decarbonisation, the document includes a range of targets and action areas in line with the transition plan. These include replacing fossil energy sources with renewable energy sources and increasing energy efficiency in all company processes. In addition to action areas within the company’s own operations, the document also describes measures to be implemented in the upstream and downstream supply chain. Based on the most significant emissions categories, engagement measures with customers and suppliers – as well as the expanded offering of low-CO2e buildings and infrastructure – are incorporated into the Environmental and Energy Policy.
The policy also aims to further develop data collection and establish effective management systems in order to continuously improve the management of identified environmental impacts. Responsibility for implementing the defined targets lies with the CEO. As part of the management review of the environmental and energy management system, the document is regularly assessed with regard to its suitability and effectiveness.
Actions and projects
ESRS E1-3
To achieve the stated reduction targets, key actions linked to targets for 2030 and 2040 have been defined for each action area. The following table shows the planned actions as well as the short-term climate targets for the individual action areas.
Decarbonisation actions
Scope | Action area | Action | Scope of application | 2030 target |
Scope 1 & Scope 2 | Buildings | Climate-neutral operation of administration buildings (own and third-party) used by the Group | Concerns existing buildings and new builds (own and third-party) managed by Corporate Real Estate Management in all countries where the Group operates | 85,0% |
Passenger cars / commercial vehicles | Conversion of vehicle fleet to renewable energy sources | Concerns the employee vehicle fleet at all divisions, central divisions and central staff divisions as well as commercial vehicles at the operating divisions (in all countries where the Group operates) | 50,0% | |
Construction site power / other construction-related energy | Energy-optimised container office | Concerns the organisational entity BMTI as well as all divisions that use construction site power (in all countries where the Group operates) | 33,3% | |
Electrification of small equipment | 66,7% | |||
Energy-efficient crane lighting during purchase of new cranes | 100% | |||
Construction machinery / heavy goods vehicles | Conversion of construction machinery and heavy goods vehicles to renewable energy sources | Concerns the organisational entity BMTI as well as all divisions that use construction machinery (in all countries where the Group operates) | 66,7% | |
Asphalt mixing plants | Conversion of asphalt mixing plants to renewable energy sources | Concerns the organisational entity BMTI as well as all divisions that with own production facilities | 33,3% | |
Stone and gravel plants | Conversion of stone and gravel plants to renewable energy sources | 50,0% | ||
Concrete plants / other production | Conversion of concrete plants and other production to renewable energy sources | 50,0% | ||
Efficiency increase | Potential to increase energy efficiency through conversion to the above-mentioned technologies | |||
Scope 3 | Structures | Direct actions: increasing energy efficiency and circularity of structures (buildings, civil engineering works) | Affects operational entities | |
Indirect actions: customer engagement; research and development (3.1 & 3.11) | Affects the upstream and downstream supply chain (suppliers, clients) | Currently being developed | ||
Building materials | Direct actions: increasing the use of low-emission building materials (steel, cement, concrete, asphalt, alternative materials) | Affects operational entities | ||
Indirect actions: customer engagement; data basis for sustainable procurement; supply chain engagement; research and development | Affects the upstream and downstream supply chain (suppliers, clients) |
A set of specific metrics was defined in 2024 to track implementation of the planned Scope 1 and Scope 2 actions and to determine their CO2e reduction potential. In the year under review, we developed a process for monitoring and reporting these metrics. At the end of 2025, the target–actual comparison of the metrics was reported to the Steering Committee Sustainability and to the Management Board.
With regard to Scope 3 actions, the distinction between direct and indirect actions is relevant, as STRABAG’s decision-making influence varies depending on the type of business activity. With in-house developments, decision-making and management authority lie with STRABAG. Both the design of the structures and the selection of construction materials used are subject to the company’s own planning and purchasing decisions. Accordingly, direct measures to increase energy efficiency and implement circular economy principles can be implemented here. In the case of third-party developments, by contrast, the final decision-making authority lies with the client. Here, primarily indirect actions are possible, in particular through targeted customer engagement and the early involvement of relevant stakeholders.
Climate policy and the energy sector as a framework
For the key actions in the individual action areas (Scope 1 and Scope 2), capital expenditure (CapEx) and operating expense (OpEx) for the period 2023 to 2030 were estimated at Group level as incremental additional or reduced expenditure compared with a business-as-usual pathway. Cost developments depend largely on climate policy and energy market framework conditions. To reflect different possible development pathways, the following three scenarios of the Network for Greening the Financial System (NGFS) were used. The underlying transition pathways were calculated using the REMIND-MAgPIE model developed by the Potsdam Institute for Climate Impact Research (PIK):
- Net Zero 2050 (NZ): In this scenario, climate policy is consistently aligned with the 1.5 °C pathway. This is associated with high CO2 prices, a massive expansion of renewable energy and a strong decline in fossil fuel demand. Emissions fall immediately and reach net zero by the late 2030s.
- Delayed Transition (DT): In this scenario, climate policy is significantly tightened only after 2030. CO2 prices therefore rise abruptly and sharply after 2030. Investments in renewable energy, electrification and hydrogen increase massively within a short period of time. Demand for fossil fuels declines abruptly. Emissions fall only from the 2030s onwards. Global warming stabilises at around 2 °C.
- Current Policies (CP): In this scenario, only actions that have already been adopted today are implemented under climate policy. CO2 prices therefore remain low. Investments in renewable energy, electrification and hydrogen increase but remain at a low level. Demand for fossil fuels remains high. The phase-out of coal, oil and gas is significantly delayed. As a result, emissions decline slowly and the world moves towards a > 3 °C pathway by 2100.
The scenarios aren’t weighted but are instead used as equally valid development pathways to illustrate a range of possible financial impacts.
The calculations show the additional and reduced costs resulting from the reduction actions. On the investment side, cost differences arise primarily from the retrofitting of existing facilities and from higher acquisition costs compared with conventional fossil-based technologies. Capital expenditures are fully recognised in the year in which they occur and are not spread over the useful life of the facilities. Operating expenses represent the difference in energy costs (energy consumption × energy price) along the reduction pathway compared with a business-as-usual pathway (without transition actions).
The presentation is based on nominal values, taking into account assumed price and cost developments. Project-specific discounting of future cash flows in order to derive investment indicators (e.g. net present value, internal rate of return) is not the subject of this analysis. The calculation serves to provide a strategic assessment of the financial impact of the greenhouse gas reduction pathway at Group level. It does not constitute a traditional economic evaluation of individual investment projects, but rather a comparative analysis of aggregated cash flows under different scenarios.
The calculations are based on simplifying assumptions and forecasts (e.g. regarding technology availability, price developments and economies of scale). For example, the expected economies of scale were derived from external studies and internal expert assessments and may be higher or lower depending on actual market penetration. In addition, the calculations are based on an assumed future energy target scenario that reflects expected technological developments and is based on internal expert assessments. This target scenario is associated with forecasting uncertainties, as it is not yet clear which technological solutions will ultimately prevail in the market. This applies in particular to production facilities and construction machinery, where several low-emission technologies are still in the development and/or pilot phase – electrified solutions and hydrogen- or biomass-based approaches, for example. Political framework conditions further complicate reliable future planning, including the lack of planning certainty for hydrogen infrastructure projects, implementation timelines, import strategies and the development of dedicated pipeline and storage networks, as well as the continuing debate over technology neutrality in energy and industrial policy. Against this background, the calculations relating to the transition are still subject to considerable uncertainty. The figures presented should therefore be understood as an initial estimate, the underlying data basis of which will be continuously refined and improved in the coming years.
Depending on the scenario, capital expenditures up to 2030 amount to between approximately € 1 billion and € 1.1 billion. Operating expenses show savings of between approximately € 160 million and € 320 million. Only an ambitious climate policy with sufficiently high CO2e prices will result in the cumulative additional and reduced costs of the transformation measures balancing out compared to the business-as-usual path by 2040. With delayed or less ambitious climate policy, this point shifts to a later period between 2045 and 2055.
Differences between the scenarios affect the individual action areas to varying degrees, particularly due to differences in CO2e and energy prices. In particular, the conversion of asphalt and concrete mixing plants can achieve sufficiently low renewable energy prices (especially industrial electricity prices) only in the scenario of an ambitious climate policy, enabling a cost-neutral or cost-advantageous conversion of the facilities compared with fossil energy sources. In addition, rapid technological market development is required both for plant technology and for large construction machinery so that the assumed economies of scale can take effect and the costs of the transition (CapEx) can decrease accordingly.
In the remaining action areas – buildings, passenger cars and commercial vehicles, construction site electricity, and stone and gravel plants – it can be assumed in all scenarios that the operational expense savings (OpEx), arising primarily from the technological shift to electrification and the associated efficiency gains, will be sufficient to offset the additional capital expenditure (CapEx). Nevertheless, it is also evident here that the more ambitious the climate policy framework conditions, the sooner this balance will be achieved.
Against this background, STRABAG advocates reliable and ambitious climate policy that provides companies with planning certainty and investment security. Key prerequisites include a future-proof emissions trading system (ETS 1 and ETS 2) and targeted investments in the expansion of renewable energy sources and the associated grid infrastructure in order to effectively support climate-friendly innovation. The scenario analysis also makes clear that the consistent reduction of fossil fuel subsidies strengthens key market-based transition incentives and thus facilitates the economic implementation of the reduction pathway for STRABAG.
As STRABAG’s products and services are to a considerable extent commissioned by public-sector clients, public procurement policy plays an essential role. It has a decisive influence on which climate-friendly solutions can be implemented in the market and thus represents a key lever for the successful implementation of the transition pathway.
STRABAG continuously implements actions to mitigate the impacts of the identified physical and transition-related climate risks. Changes to the climate are already noticeable today. STRABAG responds to these developments with appropriate actions and evaluates their effectiveness. The Group-wide physical and transition climate risk analysis was reviewed again in the reporting year. STRABAG continues to advance the management of its impacts, risks and opportunities. Additional actions and targets for mitigating material risks and impacts as well as for leveraging opportunities will be developed and disclosed in the coming years.
As these actions are not necessarily implemented as stand-alone, project-based activities and therefore are not subject to specific budgeting, it is not possible to say exactly which financial resources are allocated specifically to which of the actions listed below. Instead, they form an integral part of our ongoing business operations which are seamlessly incorporate into regular processes. Individual actions are, however, partially reflected in the CapEx and OpEx calculations presented above.
Material climate-related risks and opportunities | Current actions | Scope of application |
Extreme weather events, heat and heavy rainfall | Implementation of organisational and technical occupational safety actions to raise awareness of climate-related hazards on the construction site | Group-wide with a focus on operating entities |
Increased integration of a Group GIS (geographic information system) to identify areas and regions with flood potential and evaluate potential hazards at an early stage | ||
Drought and rising temperatures | Conducting location- and project-specific climate risk analyses | Group-wide |
Development and preparation of informative guidelines for project staff to incorporate climate risks into project planning | ||
Future mandates and regulation | Ongoing interdisciplinary collaboration between specialist departments | Group-wide |
Establishment of an internal network on ESG regulations | ||
Demand for low-carbon products and services | Implementation of partnering models to ensure that requirements are incorporated into structural planning at an early stage | Group-wide, Supply chain |
Testing, implementing and expanding low-emission business activities and construction methods | ||
Rising raw material and energy costs | Conducting economic feasibility studies on converting production facilities to alternative energy sources | Group-wide, Supply chain |
Piloting and deploying alternative powertrain technologies for construction machinery | ||
Strengthening the Group’s own building materials production (mineral and renewable raw materials) | ||
Potential for revenue growth through new business models | Consolidation of an internal service offering for the development of new business models | Group-wide |
Implementation of the adASTRA intrapreneurship programme | ||
Risk minimisation through sustainability strategy and target setting | Conducting climate-related risk and resilience analyses and aligning strategy with science-based targets | Group-wide |
Targets
ESRS E1-4
STRABAG is convinced that credible climate targets must follow a uniform standard and be externally validated. For this reason, we have committed to participating in the Science Based Targets initiative (SBTi). The targets were validated by the SBTi in the first quarter of 2026.
As part of our transition plan, we use the SBTi methodological framework as the basis for our science-based reduction pathway to 2030. This pathway was developed by an internal Group working group on the energy transition under the leadership of a member of the Management Board and with the involvement of relevant divisions, central divisions and central staff divisions. In the fourth quarter of 2025, an internal progress measurement was carried out for the first time and communicated to the Steering Committee Sustainability and the Management Board. Owing to STRABAG’s diversified business model, the cross-sector standard is applied.
The base year selected is 2023, with a baseline value of 927,472 t CO2e for Scope 1 and Scope 2 emissions (market-based). The base year and the underlying data for the reduction pathway are based on the energy consumption data for the 2023 financial year. Since 2024, STRABAG has applied new conversion factors for calculating greenhouse gas emissions. As a result of the new calculation method, the baseline value for 2023 decreases from 962,944 t CO2e to 927,472 t CO2e (-3.68 %). The reason for this is the update of emission factors in the revised internal calculation tool CarbonTracker as part of expanded CSRD reporting requirements. Due to a system change in the database, changes to the reporting boundaries cannot be ruled out. In the base year, there were no unusual capacity utilisations or other exceptional events that would have distorted emissions. When setting the targets, an annual increase in output was taken into account and this output growth was associated with a 50% increase in emissions. Our target for Scope 1 and Scope 2 emissions corresponds to an ambition level that, from a scientific perspective, is necessary to limit global warming to 1.5 °C.
For Scope 3 emissions, the targets were developed in accordance with the well-below-2-degrees scenario (WB2C), using 2023 as the base year. The baseline value for Scope 3 emissions was determined at 8,013,680 t CO2e for 2023.
The reporting boundaries of the greenhouse gas emissions considered in the reduction targets are consistent with the boundaries of the other reported greenhouse gas emissions. In line with the categories of the Greenhouse Gas Protocol (GHG), we distinguish between:
- Scope 1 & Scope 2: Compared with our base year 2023 (of which Scope 1 accounts for 83% and Scope 2 for 17%), we aim to reduce our Scope 1 and Scope 2 emissions by 42% by 2030 in accordance with the 1.5 °C scenario. By 2030, the contribution from Scope 1 to achieving the targets amounts to 32%, that of Scope 2 to 10%.
- Scope 3: Starting from the base year 2023, STRABAG aims to reduce Scope 3 emissions by 25% by 2030 in accordance with the WB2C scenario.
From 2030 onwards, the reduction target for Scope 1 & Scope 2 as well as the Scope 3 reduction target will be aligned with a 1.5 °C scenario. Climate neutrality in the target year 2040 encompasses the reduction of greenhouse gas emissions across the entire value chain (Scope 1, 2 and 3).
To achieve our targets for Scope 1, 2 and 3 emissions, we have identified specific action areas and defined concrete actions each of them. Progress in achieving the targets for Scope 1 and Scope 2 emissions is presented in the respective action areas. The action area “Efficiency increase” has been integrated into the other action areas, as its content is attributable to both scopes. The target contribution and progress measurement for the Scope 3 targets are currently being developed.
The following table shows their respective progress and contribution to target achievement.
Progress and contributions to achieving the emissions reduction targets
The shift in the energy mix as part of the transition results in both negative and positive contributions to target achievement. Negative contributions to target achievement in Scope 1 result from the replacement of fossil fuels, while positive contributions in Scope 2 result from the associated increase in electrification.
Action areas | Scope | Contribution to target achievement by 20301 | Total contribution1 | Progress 2025 | |
t CO2e2 | t CO2e2 | % | % | ||
Buildings | Scope 1 | -3,454 | -12,037 | 2.0 | 0.5 |
Scope 2 | -8,583 | ||||
Passenger cars / commercial vehicles | Scope 1 | -103,220 | -95,651 | 15.9 | -0.2 |
Scope 2 | 7,569 | ||||
Construction site power / other construction-related energy | Scope 1 | -14,433 | -90,172 | 15.0 | 5.2 |
Scope 2 | -75,739 | ||||
Construction machinery / heavy goods vehicles | Scope 1 | -240,450 | -236,965 | 39.3 | 4.0 |
Scope 2 | 3,485 | ||||
Asphalt mixing plants | Scope 1 | -107,645 | -133,449 | 22.1 | 5.1 |
Scope 2 | -25,804 | ||||
Stone and gravel plants | Scope 1 | -428 | -26,447 | 4.4 | 3.8 |
Scope 2 | -26,019 | ||||
Concrete plants / other production | Scope 1 | -1,856 | -8,025 | 1.3 | 0.9 |
Scope 2 | -6,169 | ||||
Total | Scope 1 | -471,486 | -602,747 | 100 | 19.4 |
Scope 2 | -131,261 | ||||
Structures | Scope 3 | Currently being developed | |||
Building materials | Scope 3 | Currently being developed | |||
1The metrics for each action area differ from those of the previous year because the previously separate action area “Efficiency increase” has been integrated into the individual action areas.
2In accordance with Kyoto Protocol
Overall, Scope 1 and Scope 2 emissions have decreased both relative to output and in absolute terms compared to the base year 2023. This means that nearly 20% of the target contributions for 2030 have already been achieved. Progress in the action areas of buildings, construction site power and production facilities is primarily attributable to a significant decline in Scope 2 emissions resulting from the switch to green power contracts in several countries where the Group operates. In the action area of asphalt mixing plants, two plants were also converted from lignite dust to gas, one plant from heating oil to gas. This led to a reduction in Scope 1 emissions, despite rising production volumes. In the action area of passenger cars and commercial vehicles, the electrification of the fleet that has already begun will result in a reduction of the CO2e footprint only in the coming years. The background to this is that – despite a decline in the number of diesel passenger cars – challenges remain in mapping consumption data, making a reliable interpretation difficult. The reported progress in construction machinery results primarily from improved data collection, particularly from a more precise delineation of external diesel consumption by subcontractors.
Given these remaining uncertainties in data collection, we assess our progress not only based on our actual CO2e emissions in the reporting year (compared to the base year 2023), but also using our set of KPIs and those actions whose reduction potential will only be reflected in actual CO2e emissions in the coming years. These include pilot projects and feasibility analyses, strategic implementation plans for the decarbonisation of our administrative locations, and transition projects that are currently in the process of implementation. Although these initiatives do not yet show an immediate reduction in emissions in the current financial year, they establish the technological and organisational prerequisites required to achieve our medium- and long-term climate targets. For this reason, this progress assessment is also carried out qualitatively for each action area, as illustrated in the table below. The assessment covers not only the implementation status of the ongoing initiatives but also takes into account external framework conditions – in particular market availability, technological maturity and the prevailing energy price structure for the economic implementation of relevant solutions – on which we are highly dependent.
Action are | Progress | Comment |
Buildings | The conversion of Group-owned sites is progressing as planned. Actions such as the expansion of PV systems and the extension of EV charging infrastructure are advancing successfully. For leased properties, refurbishment actions can only be influenced to a limited extent, which is why sustainable minimum standards for new leases were adopted in 2025. For administrative locations owned by the Group, the SE Management Board approved a structured decarbonisation approach. | |
Passenger cars / commercial vehicles | Continuous transition to electrification with minor deviations from target. There are currently still limitations, particularly for commercial vehicles, due to the limited driving ranges available on the market. The steady expansion of the product portfolio for the existing fleet, however, taking into account technological developments in the market (e.g. battery technology), is increasingly enabling applications with high range requirements. | |
Construction site power / other construction-related energy | The transition is taking place gradually due to the growing portfolio of manufacturers and shows only minor deviations from the target. | |
Construction machinery / heavy goods vehicles | Conversion plans and implementation directives are in place for HVO (hydrotreated vegetable oil). The availability of HVO meeting high sustainability standards is not ensured in all countries, however. In addition, price fluctuations and tax-related framework conditions make its economic use more difficult. For large electric construction machinery, market-ready availability at the required scale is currently lacking. At present, the first electrified large construction machines from various manufacturers are being tested under real operating conditions on construction sites and in production facilities. The introduction of hydrogen-powered construction machinery is delayed, as both the economic availability of hydrogen and the infrastructure fall short of the forecasts made in 2023. As a result, the market penetration of hydrogen-powered large construction machines beyond 2030 is subject to considerable uncertainty. Moreover, no corresponding construction machines are currently available on the market. As part of a pilot project, STRABAG is currently testing a hydrogen-powered wheel loader, including refuelling infrastructure, at its Gratkorn quarry. | |
Asphalt mixing plans | Actions to reduce emissions – such as improving efficiency or switching to energy sources with lower specific emission factors – are being implemented within the limits of economic feasibility. The transition to renewable energy sources is proceeding slowly, however, as no economically viable alternatives are available on the market at present and it remains unclear which of the potential solutions – such as electrification, hydrogen or biomass – will prevail among plant manufacturers in the long term. At the same time, however, STRABAG is conducting pilot projects, feasibility analyses and research activities on various technology options. The potential use of biofuels – currently the only measure that could be implemented quickly – is limited not only by high prices and resource constraints but also by tax-related framework conditions, resulting in considerable uncertainty regarding medium- and long-term availability and economic viability. | |
Stone and gravel plants | Due to the ongoing transition to green electricity, implementation is proceeding as planned. | |
Concrete plants / other production | Due to the ongoing transition to green electricity, implementation is proceeding as planned. |
Metrics
Energy and CO2e data for the Group are systematically recorded and analysed using CarbonTracker, a software solution developed in-house by STRABAG in 2012. The software is regularly updated and further developed. In the 2024 financial year, CarbonTracker was fundamentally revised in response to changing reporting requirements under the CSRD Directive and the Group’s objective of improving data quality. It was further optimised in 2025. These optimisations primarily relate to the recording of accounting data reflecting the progress of ongoing reduction actions. In addition, the data basis was optimised and expanded in the areas of waste disposal, HVO and the use of green electricity, as well as emissions from the use of products (Scope 3.11).
A detailed description is provided in the following sections. The calculation of the energy data published here is largely carried out through our internal ERP system. The energy expenses recorded there are converted into corresponding calorific values using a financial calculation basis. For this purpose, quarterly average prices are determined at country level and used for the conversion. To present Scope 1 and Scope 2 emissions, the calculated calorific values are then linked to the corresponding CO2e emission factors and mapped in CarbonTracker down to the smallest organisational entity. Given the complexity involved in compiling energy and greenhouse gas data – particularly in a diversified Group of our size – minor deviations may occur.
ESRS E1-5
The functionalities of CarbonTracker enable a detailed analysis of energy consumption across the Group. According to the evaluations for 2025, total energy consumption amounted to 3,290,497 MWh, of which around 7.48% was provided through the generation of renewable energy. This corresponds to an increase in energy from renewable sources of 3.48% compared with the previous year. Particularly noteworthy is the significant increase in the share of green electricity from 3.16% to 6.94%, as well as the proportion of solar energy used for internal consumption, which amounted to 3,187 MWh. A further 1,646 MWh was fed into public grids.
The volume of solar energy produced in-house in 2025 grew to 4,833 MWh compared with the previous year (+55.15%), driven mainly by the commissioning of additional solar power plant sites.
Own energy production
2024 | 2025 | |
Solar energy (MWh) | 3,115 | 4,833 |
Energy sources in the fuel category, at 1,849,736 MWh, represent the most significant share for the Group. Of this amount, 13,638 MWh can be identified through detailed analysis as fuel from renewable sources (HVO).
Energy consumption and energy mix
2024 | 2025 | |
|---|---|---|
Fossil energy | ||
(1) Fuel consumption from coal and coal products (MWh) | 533,526 | 542,239 |
(2) Fuel consumption from crude oil and petroleum products (MWh) | 2,089,585 | 1,980,195 |
(3) Fuel consumption from natural gas (MWh) | 305,123 | 305,593 |
(4) Fuel consumption from other fossil sources (MWh) | 29,994 | 40,604 |
(5) Consumption of purchased or acquired electricity, heat, steam and cooling from fossil sources (MWh) | 269,707 | 161,123 |
(6) Total fossil energy consumption1 (MWh) | 3,227,936 | 3,029,753 |
Share of fossil sources in total energy consumption (%) | 95.20 | 92.08 |
Nuclear energy | ||
(7) Consumption from nuclear sources (MWh) | 43,555 | 14,600 |
Share of consumption from nuclear sources in total energy consumption (%) | 1.28 | 0.44 |
Renewable energy | ||
(8) Fuel consumption from renewable sources, including biomass (MWh) | 9,883 | 14,714 |
(9) Consumption of purchased or acquired electricity, heat, steam and cooling from renewable sources (MWh) | 107,295 | 228,243 |
(10) Consumption of self-generated non-fuel renewable energy (MWh) | 2,197 | 3,187 |
(11) Total renewable energy consumption2 (MWh) | 119,375 | 246,144 |
Share of renewable sources in total energy consumption (%) | 3.52 | 7.48 |
Total energy consumption3 (MWh) | 3,390,866 | 3,290,497 |
1Calculated as the sum of lines 1 to 5
2Calculated as the sum of lines 8 to 10
3Calculated as the sum of lines 6, 7 and 11
STRABAG’s business activities were assigned to the individual NACE sections with a higher level of detail compared with 2024. As a result, 87% are classified under NACE section F, 7% under NACE section M, and 5% under NACE section C. Energy intensity per thousand € of revenue amounts to 0.18. The net revenue used to determine this metric corresponds to the revenue presented in the consolidated income statement.
Energy intensity
2024 | 2025 | % 2025 / 2024 | |
Total energy consumption from activities in high climate impact sectors per net revenue from activities in high climate impact sectors (MWh / T€) | 0.19 | 0.18 | -7.46 |
Greenhouse gas emissions
ESRS E1-6
The CO2e inventory for the 2025 financial year relates to the Group’s full scope of consolidation and includes the CO2e emissions generated in 70 countries. Emissions are reported in Scope 1, Scope 2 and Scope 3 as defined by the GHG Protocol and in accordance with the CSRD Directive.
Notes on Scope 1 and Scope 2 emissions
Scope 1 and Scope 2 emissions are calculated on the basis of the Group-wide energy consumption recorded in CarbonTracker. The calculation follows a spend-based approach. For locations with green electricity supply contracts, an emissions-free electricity supply is taken into account in the market-based calculation of Scope 2 emissions. Compared with the previous year, the share of such locations was expanded from parts of Germany and Austria to additional regions in Poland, Romania, Serbia, Croatia, Hungary, the Czech Republic and Slovakia.
Greenhouse gas accounting is carried out by converting energy values using specific emission factors. These are mainly provided by the database operator Climatiq, which prepares them in accordance with the requirements of the GHG Protocol.
Scope 2 emissions from purchased heat and purchased electricity are reported using both the market-based and the location-based method. In addition, emissions from category 3.3 “Fuel- and energy-related activities not included in Scope 1 or Scope 2” are reported using the market-based calculation approach. The location-based calculation is based on the emission factor database of the International Energy Agency (IEA), whose values are reviewed by STRABAG for currency every two years.
This database is also used for country-specific emission factors for district heating. With regard to the market-based calculation, supplier-specific emission factors are applied for locations with green electricity tariffs, provided the corresponding guarantees of origin (certificates) are available. As a result, bundled contractual instruments account for 57% of market-based Scope 2 emissions. Where no tariff-specific emission factors are available, the emission factor used – provided by the Association of Issuing Bodies (AIB) – is based on the residual mix. This residual mix takes into account green electricity shares already contractually allocated elsewhere and therefore removed from the overall mix. As the residual mix is not available for all Group countries, the IEA emission factor is applied for the remaining countries.
Biogenic CO2 emissions are reported separately and amount to 6,954 t CO2 (market-based) and 14,669 t CO2 (location-based). Of this total, 3,792 t CO2 arise from Scope 1, 3,162 t CO2 (market-based) or 10,876 t CO2 (location-based) from Scope 2, and 0.12 t CO2 from Scope 3. For lignite dust, emission factors provided by local suppliers are also used.
Notes on Scope 3 emissions
Upstream and downstream Scope 3 emissions for relevant categories were published for the first time in 2024 as part of reporting in accordance with the CSRD. For the 2025 reporting year, categories 3.7 “Employee commuting”, 3.9 “Downstream transportation and distribution”, and 3.10 “Processing of sold products” were classified as not significant. The classification is based on the significance criterion of size, as these categories together account for less than 5% of the total footprint. Other categories of similar magnitude remain classified as significant due to additional criteria such as influenceability and awareness potential. For categories classified as not significant, the emissions of the previous year are carried forward. A recalculation is carried out in the event of significant structural changes within the Group, but at least every three years.
For the six most important building materials used by the Group – asphalt, bitumen, stone/gravel, steel, concrete and cement, and timber – prices are first determined and then converted into CO2e quantities using suitable quantity-based emission factors. For the remaining upstream Scope 3 emissions as well as for certain downstream Scope 3 categories (e.g. 3.13 “Downstream leased assets” and 3.15 “Investments”), a cost-based approach is applied. In combination with cost-based, country-specific emission factors, the corresponding emission values are determined. The calculation of category 3.3 (“Fuel- and energy-related activities not included in Scope 1 or Scope 2”) is based on the same energy quantities used for Scope 1 and Scope 2, but applies separate emission factors that reflect emissions generated during the production and transport of the energy carriers and electricity used. For category 3.3, a distinction is made between market-based and location-based emission factors. The greenhouse gas inventory under E1-6, however, presents only the market-based approach, as required by the mandatory ESRS table template.
In the 2025 reporting year, the emission factors for category 3.5 “Waste generated in operations” were also adjusted, taking into account disposal assumptions based on literature sources and internal expert knowledge. These replace the conservative emission factors used for the 2024 financial reporting, which had been applied because the methodology for calculating disposal rates had not yet been fully validated at that time. The adjustments underline our ongoing efforts to further develop and improve the underlying data basis. As a result of the adjustments described, the proportion of primary data decreased from the original 2% to 0.17%.
Emissions for Scope 3 Category 5
2025 (new calculation method) | 2024 (new calculation method) | 2024 (old calculation method) | |
Emissions for Scope 3 Category 5 (t CO2e) | 16,686 | 16,000 | 229,093 |
For category 3.11 “Use of sold products”, which considers emissions arising during the use phase of construction projects implemented by STRABAG as general contractor, a more detailed calculation was carried out and the relevant main business field groups were expanded. This was based on the extensive experience of STRABAG’s experts from the respective areas.
The activities of category 3.14 are not part of STRABAG’s business model and were therefore identified as not relevant.
The results of the risk analyses conducted to date confirm that the most significant transition impacts continue to correspond to the largest Scope 3 categories (see upstream “Rising raw material and energy costs” and downstream “Demand for low-carbon products and services”). As part of the annual review of the transition risk analysis, Scope 3 data are continuously incorporated in order to further refine the Group’s understanding of transition-related climate risks.
Milestones and target years | ||||||||
|---|---|---|---|---|---|---|---|---|
Base year (2023) | 2024 | 2025 | % 2025 / 2024 | 2025 | 2030 | 2040 | Annual target compared to base year | |
Scope 1 GHG emissions (t CO2e) | ||||||||
Gross Scope 1 GHG emissions (t CO2e) | 772,298 | 790,336 | 777,946 | -1.57 | ||||
Percentage of Scope 1 GHG emissions from regulated emission trading schemes (%) | 0.00 | 0.00 | 0.00 | |||||
Scope 2 GHG emissions (t CO2e) | ||||||||
Gross location-based Scope 2 GHG emissions (t CO2e) | 150,171 | 156,306 | 146,722 | -6.13 | ||||
Gross market-based Scope 2 GHG emissions (t CO2e) | 155,174 | 158,504 | 89,283 | -43.67 | ||||
Scope 3 GHG emissions (t CO2e) | ||||||||
Significant Scope 3 GHG emissions | 9,910,025 | 9,053,179 | 8,586,371 | -5.16 | ||||
3.1 Purchased goods and services | 5,795,372 | 5,474,338 | 5,365,165 | -1.99 | ||||
3.2 Capital goods | 193,237 | 208,674 | 213,943 | 2.52 | ||||
3.3 Fuel and energy-related activities (not included in Scope1 or Scope 2)1 | 166,679 | 168,456 | 155,201 | -7.87 | ||||
3.4 Upstream transportation and distribution | 61,539 | 64,088 | 62,791 | -2.02 | ||||
3.5 Waste generated in operations | 236,013 | 229,093 | 16,686 | -92.72 | ||||
3.6 Business travel | 33,187 | 33,055 | 34,994 | 5.87 | ||||
3.7 Employee commuting | 62,676 | 59,183 | 59,183 | 0.00 | ||||
3.8 Upstream leased assets | 126,528 | 122,222 | 126,205 | 3.26 | ||||
3.9 Downstream transportation and distribution | 85,674 | 90,778 | 90,778 | 0.00 | ||||
3.10 Processing of sold products | 20,741 | 21,978 | 21,978 | 0.00 | ||||
3.11 Use of sold products | 2,218,308 | 1,704,432 | 1,539,948 | -9.65 | ||||
3.12 End-of-life treatment of sold products | 687,236 | 677,545 | 714,667 | 5.48 | ||||
3.13 Downstream leased assets | 11,219 | 12,329 | 11,541 | -6.39 | ||||
3.15 Investments1 | 211,617 | 187,007 | 173,291 | -7.33 | ||||
Total GHG emissions | ||||||||
Total GHG emissions (location-based) (t CO2e) | 10,839,047 | 10,027,735 | 9,532,543 | -4.94 | ||||
Total GHG emissions (market-based) (t CO2e) | 10,837,497 | 10,002,019 | 9,453,600 | -5.48 | 10,153,795 | 8,444,539 | -3.15 | |
1Only market-based values are reported for this category.
The greenhouse gas intensity per thousand € revenue is 0.51 (location-based and market-based). The net revenue used to determine the metric corresponds to the revenue presented in the consolidated income statement.
Greenhouse gas intensity
2024 | 2025 | % 2025 / 2024 | |
Total GHG emissions (location-based) per net revenue (t CO2e) / T€) | 0.58 | 0.51 | -12.18 |
Total GHG emissions (market-based) per net revenue (t CO2e) / T€) | 0.57 | 0.51 | -11.38 |
ESRS E1-7
STRABAG’s plants and facilities are currently not required to participate in the European Emissions Trading System (EU ETS). Despite all efficiency and substitution actions, it must be assumed that a baseline level of difficult-to-avoid greenhouse gas emissions that will have to be offset may remain in the medium term. To achieve the climate targets, an internal offsetting guideline was therefore developed to regulate the future purchase of carbon credits across the Group. This guideline stipulates that investments may only be made in Gold Standard–certified projects. Alternatively, in line with the internal requirements, it is also possible to purchase EU carbon allowances under the EU Emissions Trading System. At present, carbon credits or EU carbon allowances are not purchased to offset STRABAG’s own emissions. Such actions are carried out exclusively on behalf of customers who wish to use them to optimise their own CO2e inventory. In these cases, STRABAG acts within the framework of the agreed project requirements and ensures that only Gold Standard–certified projects or EU carbon allowances are considered, as stipulated in the internal offsetting guideline. To date, no proprietary projects have been implemented by STRABAG on the voluntary carbon market.
ESRS E1-8
STRABAG currently does not apply internal carbon pricing.
Sources – Climate Change
United Nations Framework Convention on Climate Change (UNFCCC). (2021). A Beginner’s Guide to Climate Neutrality. Retrieved 18 February 2026.